The Near Real-time data shown in the plots below is updated every four hours.
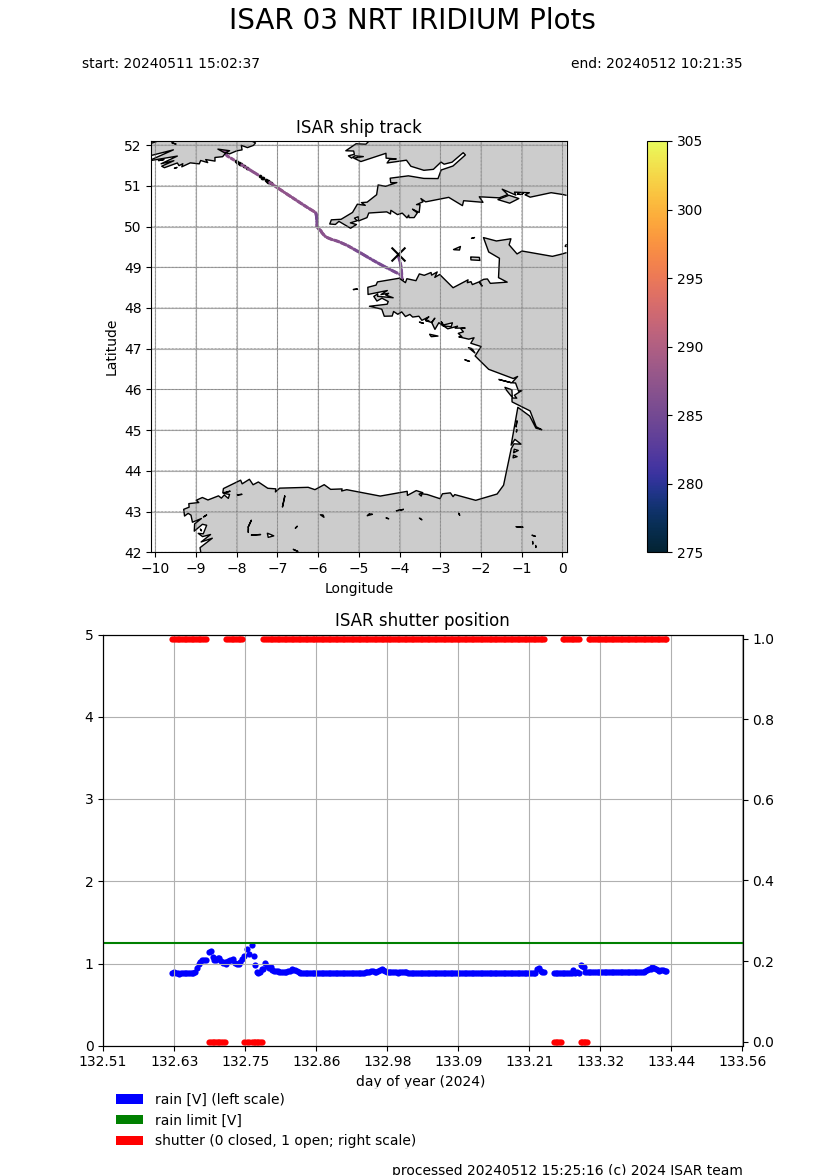
Figure 1: Near Real-time data plot from the Pont Aven. The top plot shows the ship track with the colour of the track representing the SST. The cross shows the latest ship position. A black track means no SST was measured. The lower plot shows the voltage measured by the rain gauge in blue and the shutter state in red.
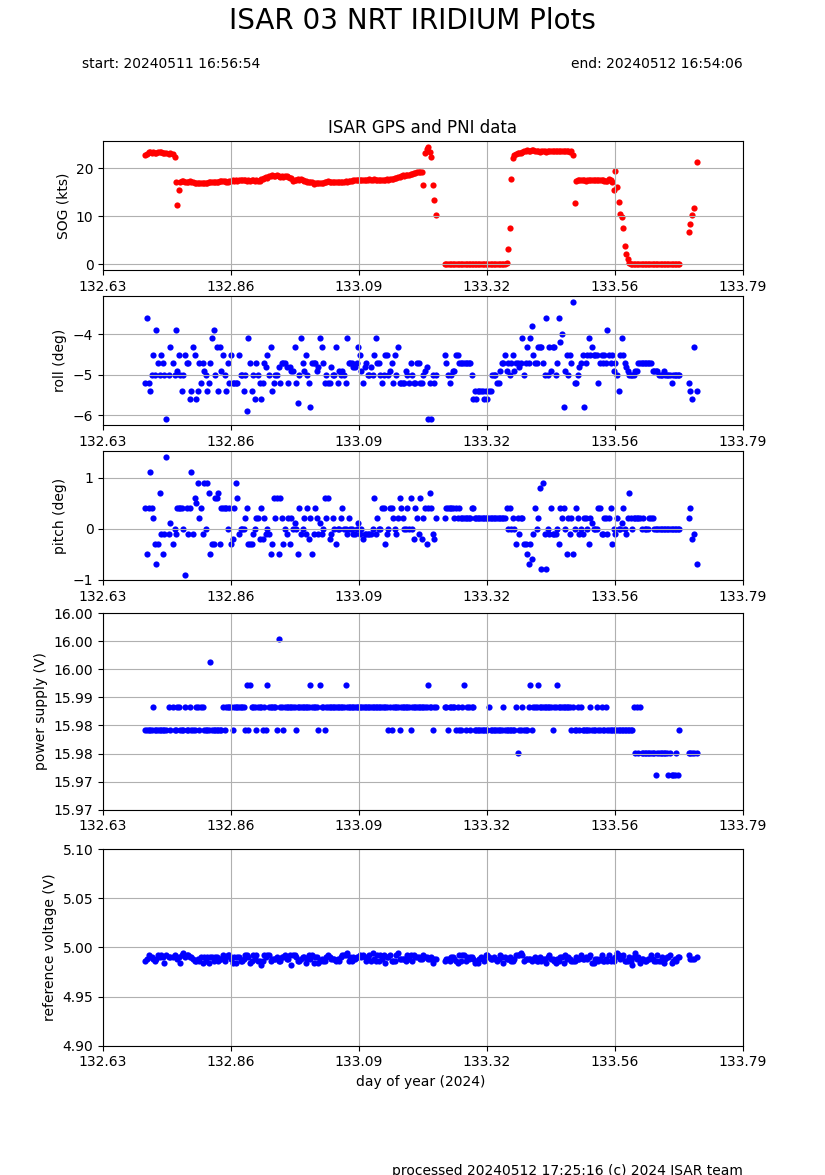
Figure 2: Near Real-time data plot from the Pont Aven. The top plot shows the ships speed over ground, the second and third plots from the top shows the roll and pitch of the ship . The forth plot shows the power supply voltage and the bottom plot shows the thermistor reference voltage.
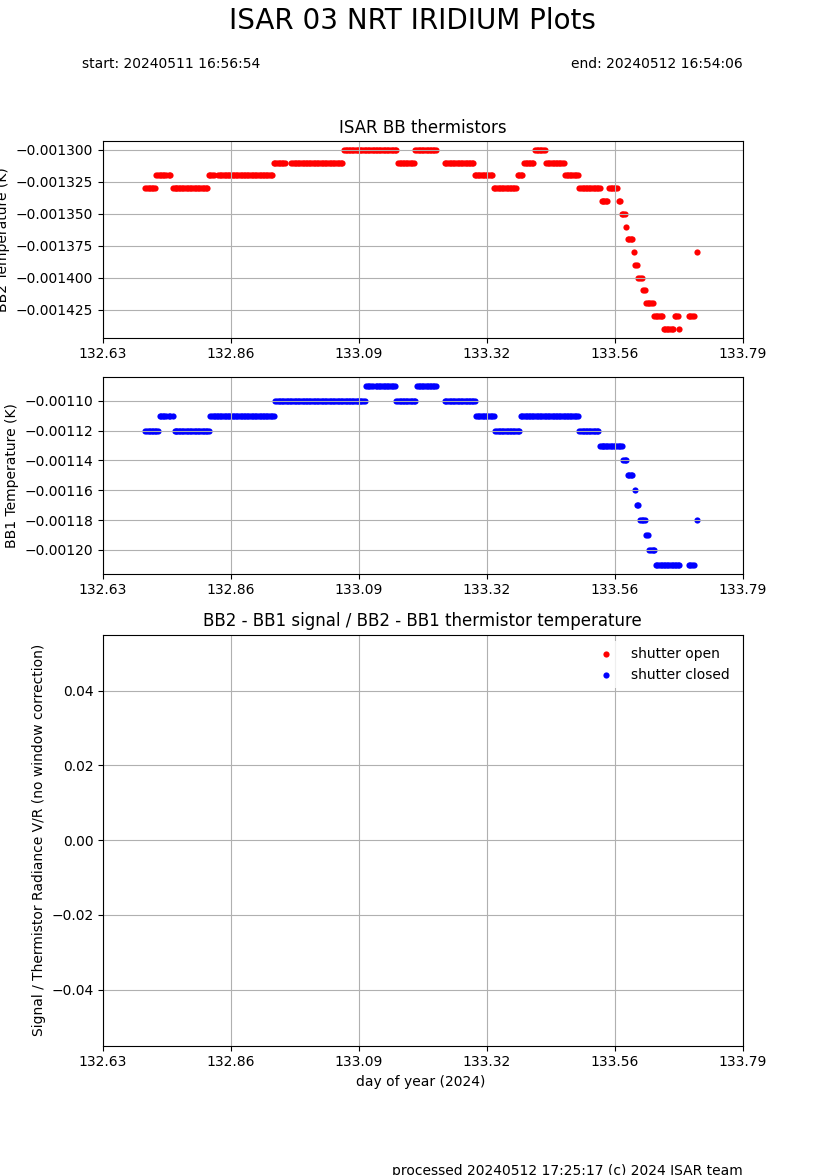
Figure 3: Near Real-time data plot from the Pont Aven. The top plot shows the heated black body temperature, the second plot shows the ambient black body temperature and the bottom plot shows the mirror gain performance.