The ISAR project validates on a routine bases the SST L2 products of AATSR. In addition to the AATSR validation we also validate most of the L2p and L4 products from the GHRSST project.
The AATSR validation programme uses various sources to answer the question whether AATSR is meeting its specification and returning acceptable measurements. ISAR takes part in the validation program under a DECCcontract. The match-ups between AATSR and ISAR data are produced after each deployment when the post deployment calibration is completed. The match-ups are classified in different grades where grade 3 has the widest limits (within 2hrs and 0.2 deg of latitude) and grade 1 is the finest (within 30 min and 1 km) The figure below shows an example for a ISAR - AATSR validation.
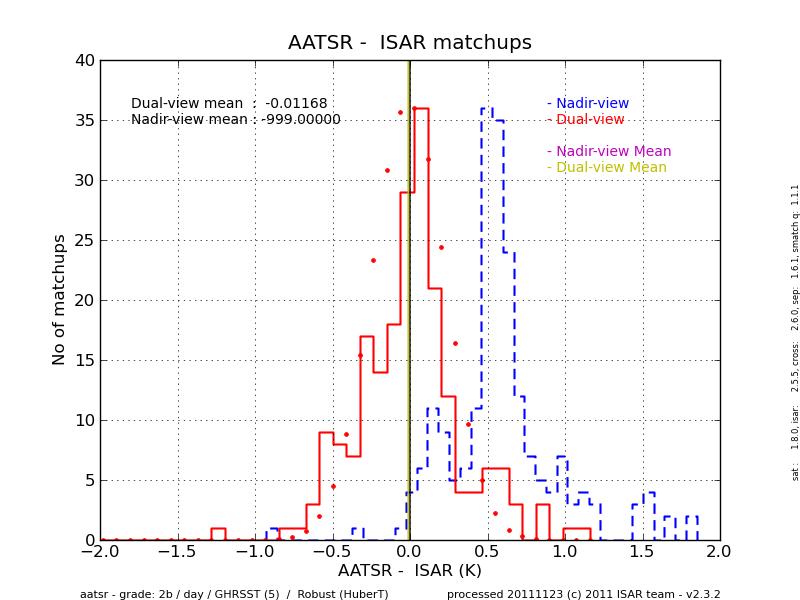
Figure 1: AATSR - ISAR histogram for day time match-ups between 22.07.2011 and 28.11.2011 within 2h and 1km. The solid red line represents the dual view match-ups and the dashed blue line the nadir view match-ups.
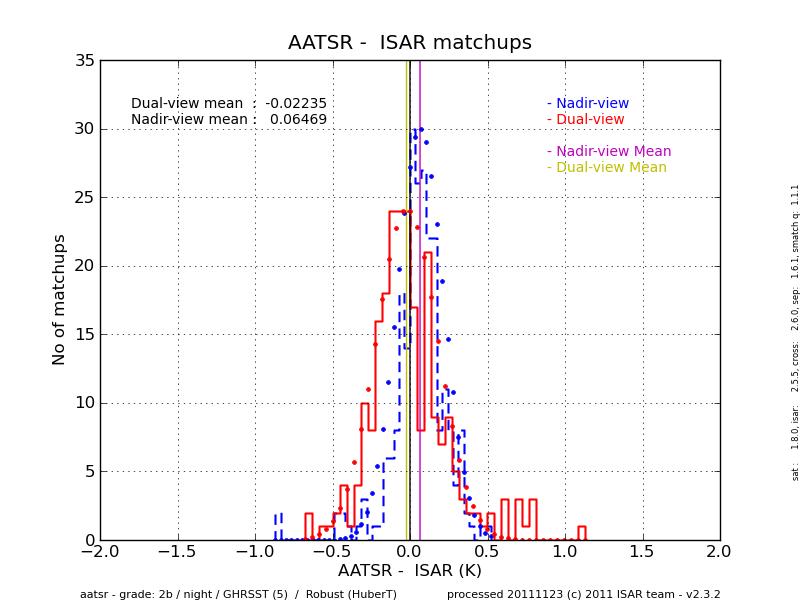
Figure 2: AATSR - ISAR histogram for night time match-ups between 22.07.2011 and 28.11.2011 within 2h and 1km.. The solid red line represents the dual view match-ups and the dashed blue line the nadir view match-ups.
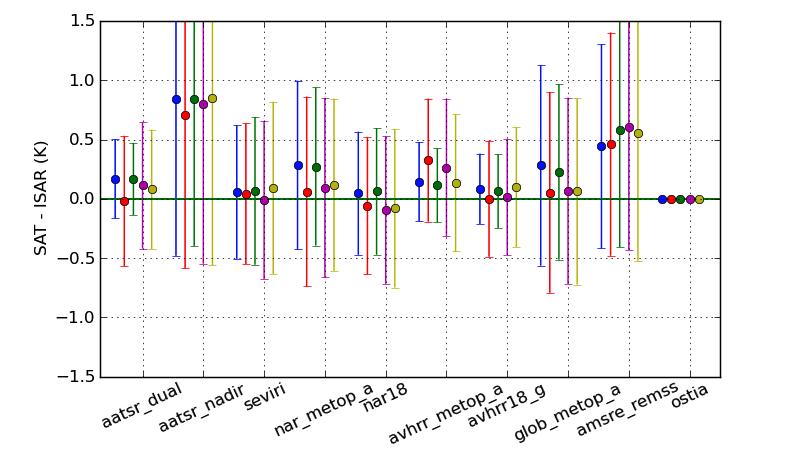
Figure 3: GHRSST - ISAR results for day time match-ups for 2010. The dot represents the mean of the match-up and the error bar the standard deviation. The colour of the lines represents the different match-up window; blue for 0.5 hour and 1 km, red 0.5 h and 20km, green 2h and 1km, magenta 2h and 20km and yellow 6 h and 25km. The product names are aatsr_dual for AATSR ducal view product, aatsr_nadir for the AATSR andir only product, seviri for the OSI-SAF SEVIRI SST L2p product, nar_metop_a for the OSI-SAF MetOp A NAR L2p product, nar18 for the OSI-SAF NOAA 18 NAR L2p product, avhrr_metop_a for the OSI-SAF MetOp A GAC L2p product, avhrr18_g for the NOAA 18 GAC L2p product, glob_metop_a for the OSI-SAF MetOp A global L2p product, amsre_remss for the Remote Sensing Systems AMSR-E L2p product and ostia for the MetOffice Ostia analysis L4 product.
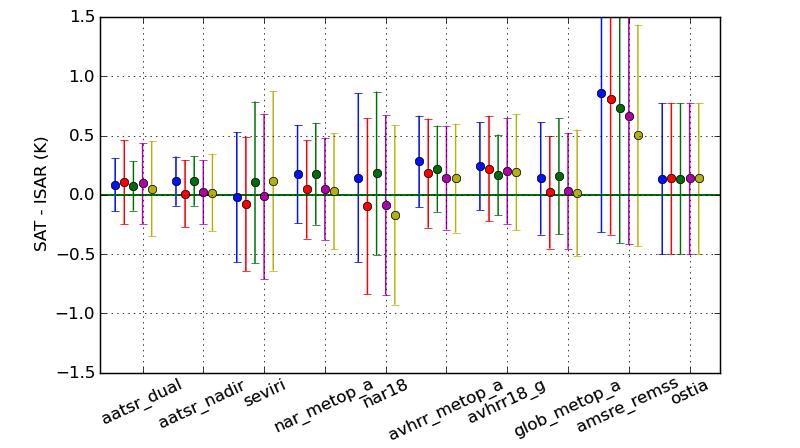
Figure 4: GHRSST - ISAR results for night time match-ups for 2010. The dot represents the mean of the match-up and the error bar the standard deviation. The colour of the lines represents the different match-up window; blue for 0.5 hour and 1 km, red 0.5 h and 20km, green 2h and 1km, magenta 2h and 20km and yellow 6 h and 25km. The product names are aatsr_dual for AATSR ducal view product, aatsr_nadir for the AATSR andir only product, seviri for the OSI-SAF SEVIRI SST L2p product, nar_metop_a for the OSI-SAF MetOp A NAR L2p product, nar18 for the OSI-SAF NOAA 18 NAR L2p product, avhrr_metop_a for the OSI-SAF MetOp A GAC L2p product, avhrr18_g for the NOAA 18 GAC L2p product, glob_metop_a for the OSI-SAF MetOp A global L2p product, amsre_remss for the Remote Sensing Systems AMSR-E L2p product and ostia for the MetOffice Ostia analysis L4 product.
